14484 (T > C)

General info

Mitimpact ID
MI.23790
Chr
chrM
Start
14484
Ref
T
Alt
C
Gene symbol
MT-ND6 Extended gene annotation
Gene position
190
Gene start
14149
Gene end
14673
Gene strand
-
Codon substitution
ATG/GTG
AA pos
64
AA ref
M
AA alt
V
Functional effect
missense
OMIM ID
HGVS
NC_012920.1:g.14484T>C
HGNC ID
RC complex
I
Ensembl gene ID
Ensembl protein ID
Ensembl transcript ID
Uniprot ID
Uniprot name
Ncbi gene ID
Ncbi protein ID
Powered by NGL Viewer
Powered by MitoWheel

Conservation

PhyloP 100v
-1.482 Conservation Score
PhyloP 470way
-0.435 Conservation Score
PhastCons 100v
0 Conservation Score
PhastCons 470way
0.952 Conservation Score

Pathogenicity predictors

PolyPhen2
Probably damaging Score and details of the predictor
SIFT
Neutral Score and details of the predictor
SIFT4G
Damaging Score and details of the predictor
VEST
Neutral Score and details of the predictor
MitoClass 1
Neutral Score and details of the predictor
SNPDryad
Neutral Score and details of the predictor
MutationTaster
Polymorphism Score and details of the predictor
fathmm
Tolerated Score and details of the predictor
AlphaMissense
Likely benign Score and details of the predictor
CADD
Neutral Score and details of the predictor
PROVEAN
Tolerated Score and details of the predictor
Mutation Assessor
Medium Score and details of the predictor
EFIN SP
Damaging Score and details of the predictor
EFIN HD
Neutral Score and details of the predictor
MLC
Neutral Score and details of the predictor
PANTHER
Neutral Score and details of the predictor
PhD-SNP
Disease Score and details of the predictor

Pathogenicity meta-predictors

APOGEE1
Pathogenic Score and details of the meta-predictor
APOGEE2
Likely-pathogenic Score and details of the meta-predictor
CAROL
Deleterious Score and details of the meta-predictor
Condel
Neutral Score and details of the meta-predictor
COVEC WMV
Deleterious Score and details of the meta-predictor
MtoolBox
Deleterious Score and details of the meta-predictor
DEOGEN2
Tolerated Score and details of the meta-predictor
Meta SNP
Disease Score and details of the meta-predictor

Cancer-specific predictors

PolyPhen2 transf
Low impact Score and details of the cancer-specific predictor
SIFT transf
Medium impact Score and details of the cancer-specific predictor
MutationAssessor transf
Medium impact Score and details of the cancer-specific predictor
CHASM
Neutral Score and details of the cancer-specific predictor

Databases of Frequencies and Phenotypes

Clinvar ID
Clinvar ALLELEID
24727
Clinvar CLNDISDB
Mondo:mondo:0044970, medgen:c0751651, orphanet:68380;

human phenotype ontology:hp:0001086, human phenotype ontology:hp:0001112, mondo:mondo:0010788, medgen:c0917796, omim:535000, orphanet:104;

medgen:cn517202;

mondo:mondo:0009723, medgen:c0023264, omim:256000, orphanet:506
Clinvar CLNDN
Mitochondrial disease;

leber optic atrophy;

not provided;

leigh syndrome
Clinvar CLNSIG
Pathogenic
MITOMAP Allele
MITOMAP Disease Clinical info
Lhon
MITOMAP Disease Status
Cfrm [p]
MITOMAP Disease Hom/Het
+/+
MITOMAP General GenBank Freq
0.1129%
MITOMAP General GenBank Seqs
69
MITOMAP General GenBank Curated refs
11579587 36737829 17334960 34122299 10520236 31619780 31482278 7853025 28994349 8931573 16083845 19800080 19098324 10545708 15720387 27803870 1417830 24508359 15954041 20074547 23665487 21067478 32220313 15629831 9852675 16120317 17479363 18806273 19525327 29133642 19047048 37988592 38346855 10976107 23111160 17886296 16972023 9012411 31932089 11741983 15629832 20301353 12205655 12711217 14748908 8680405 7611298 28040497 31817256 15060117 12638016 29454364 33706792 15033723 17122117 11124301 21457906 27071925 37587338 30369864 21694444 19370763 2018041 28716668 22749828 7823072 17292333 15282179 15282189 12827453 16532388 27741086 36361994 34415266 29336589 34732400 19247386 29980632 1732158 18402672 33552719 12518276 17899121 19936068 30712826 30822445 16523671 34573281 18235013 15467980 10631164 22194643 12749053 27847334 29253894 21788663 30081212 29428506 27177320 27746671 9302261 25909222 34168607 17403843 20491810 27787713 31566038 7599218 19268652 12379308 32704028 20471050 25192510 25053773 23674761 29996615 23063736 8533781 11504997 20064630 33911213 20809775 34673906 14671420 9150158 30008192 32861874 20976138 33159657 21928272 7735876 21397051 10426138 16829155 15883259 18440284 8470982 21859767 36051150 17452034 31776719 10072046 30201499 27721048 26404827 29189152 36827238 35104579 35773337 7603534 15483043 7977345 33101779 15548492 12446713 8582049 15342361 17406640 15972314 27582625 7612556 12724691 8213820 17942074 35723074 24369379 7635294 11754070 22410442 20943885 32991883 11450909 36565700 16380918 28455970 21253496 25338955 7770132 20123042 11001192 31619779 18344382 36565701 9177303 12436196 9412783 16564802 28991104 17894548 7821467 35567411 35623556 28944608 29387390 7604366 12464729 29983856 18320530 34670133 37878684 31040363 20599858 11523562 37537557 18674747 21685233 8742999 37038312 9339703 8659531 12464728 12807863 28481993 16120433 20628600 33477675 32105823 1463007 29249004 26605371 19394449 7877803 32991388 35130313 7760326 12112086 35858578 18214789 8941270 28314831 19255150 11938495 21887510 18070226 33584522 19319978 15635488 11331900 24398099 22258525 32111141 33095398 8071952 33360266 28392196 28233183 19733221 11853713 31605306 20211598 16050984 28761322 9484365 16806060 27127184 34915201 19710181 30881859 8659512 15272763 21810891 15126312 8755941 9561832 11339587
MITOMAP Variant Class
disease
Gnomad AN
56427
Gnomad AC hom
30
Gnomad AF hom
0.0005316
Gnomad AC het
7
Gnomad AF het
0.000124
Gnomad filter
Pass
HelixMTdb AC hom
144
HelixMTdb AF hom
0.0007347
HelixMTdb AC het
26
HelixMTdb AF het
0.0001326
HelixMTdb mean ARF
0.34311
HelixMTdb max ARF
0.82803
ToMMo JPN54K AC
15
ToMMo JPN54K AF
0.000276
ToMMo JPN54K AN
54300
COSMIC 90
.
dbSNP 156

Residue interaction

EVmutation
Site A-B InterP
Site A-B IntraP
ΔΔG intra
ΔΔG intra interface
ΔΔG inter

Compensated Pathogenic Deviations

Frequency
0.15 CPD variant frequency
AA ref
M
CPD AA alt
V
Aln pos
66
RefSeq protein ID
Species name
Meriones unguiculatus
Ncbi taxon ID

14484 (T > A)

General info

Mitimpact ID
MI.23791
Chr
chrM
Start
14484
Ref
T
Alt
A
Gene symbol
MT-ND6 Extended gene annotation
Gene position
190
Gene start
14149
Gene end
14673
Gene strand
-
Codon substitution
ATG/TTG
AA pos
64
AA ref
M
AA alt
L
Functional effect
missense
OMIM ID
HGVS
NC_012920.1:g.14484T>A
HGNC ID
RC complex
I
Ensembl gene ID
Ensembl protein ID
Ensembl transcript ID
Uniprot ID
Uniprot name
Ncbi gene ID
Ncbi protein ID
Powered by NGL Viewer
Powered by MitoWheel

Conservation

PhyloP 100v
-1.482 Conservation Score
PhyloP 470way
-0.435 Conservation Score
PhastCons 100v
0 Conservation Score
PhastCons 470way
0.952 Conservation Score

Pathogenicity predictors

PolyPhen2
Probably damaging Score and details of the predictor
SIFT
Neutral Score and details of the predictor
SIFT4G
Tolerated Score and details of the predictor
VEST
Neutral Score and details of the predictor
MitoClass 1
Neutral Score and details of the predictor
SNPDryad
Neutral Score and details of the predictor
MutationTaster
Disease Score and details of the predictor
fathmm
Tolerated Score and details of the predictor
AlphaMissense
Likely benign Score and details of the predictor
CADD
Neutral Score and details of the predictor
PROVEAN
Tolerated Score and details of the predictor
Mutation Assessor
Neutral Score and details of the predictor
EFIN SP
Neutral Score and details of the predictor
EFIN HD
Neutral Score and details of the predictor
MLC
Neutral Score and details of the predictor
PANTHER
.
PhD-SNP
.

Pathogenicity meta-predictors

APOGEE1
Neutral Score and details of the meta-predictor
APOGEE2
Likely-benign Score and details of the meta-predictor
CAROL
Neutral Score and details of the meta-predictor
Condel
Deleterious Score and details of the meta-predictor
COVEC WMV
Neutral Score and details of the meta-predictor
MtoolBox
Deleterious Score and details of the meta-predictor
DEOGEN2
Tolerated Score and details of the meta-predictor
Meta SNP
.

Cancer-specific predictors

PolyPhen2 transf
Low impact Score and details of the cancer-specific predictor
SIFT transf
High impact Score and details of the cancer-specific predictor
MutationAssessor transf
Low impact Score and details of the cancer-specific predictor
CHASM
Neutral Score and details of the cancer-specific predictor

Databases of Frequencies and Phenotypes

Clinvar ID
.
Clinvar ALLELEID
.
Clinvar CLNDISDB
.
Clinvar CLNDN
.
Clinvar CLNSIG
.
MITOMAP Allele
MITOMAP Disease Clinical info
.
MITOMAP Disease Status
.
MITOMAP Disease Hom/Het
./.
MITOMAP General GenBank Freq
0.0%
MITOMAP General GenBank Seqs
0
MITOMAP General GenBank Curated refs
.
MITOMAP Variant Class
polymorphism
Gnomad AN
56434
Gnomad AC hom
1
Gnomad AF hom
1.77e-05
Gnomad AC het
0
Gnomad AF het
0.0
Gnomad filter
Pass
HelixMTdb AC hom
3
HelixMTdb AF hom
1.53e-05
HelixMTdb AC het
0
HelixMTdb AF het
0.0
HelixMTdb mean ARF
0.0
HelixMTdb max ARF
.
ToMMo JPN54K AC
.
ToMMo JPN54K AF
.
ToMMo JPN54K AN
.
COSMIC 90
.
dbSNP 156

Residue interaction

EVmutation
Site A-B InterP
Site A-B IntraP
ΔΔG intra
ΔΔG intra interface
ΔΔG inter

Compensated Pathogenic Deviations

Frequency
.
AA ref
.
CPD AA alt
.
Aln pos
.
RefSeq protein ID
.
Species name
.
Ncbi taxon ID
.

14484 (T > G)

General info

Mitimpact ID
MI.23792
Chr
chrM
Start
14484
Ref
T
Alt
G
Gene symbol
MT-ND6 Extended gene annotation
Gene position
190
Gene start
14149
Gene end
14673
Gene strand
-
Codon substitution
ATG/CTG
AA pos
64
AA ref
M
AA alt
L
Functional effect
missense
OMIM ID
HGVS
NC_012920.1:g.14484T>G
HGNC ID
RC complex
I
Ensembl gene ID
Ensembl protein ID
Ensembl transcript ID
Uniprot ID
Uniprot name
Ncbi gene ID
Ncbi protein ID
Powered by NGL Viewer
Powered by MitoWheel

Conservation

PhyloP 100v
-1.482 Conservation Score
PhyloP 470way
-0.435 Conservation Score
PhastCons 100v
0 Conservation Score
PhastCons 470way
0.952 Conservation Score

Pathogenicity predictors

PolyPhen2
Probably damaging Score and details of the predictor
SIFT
Neutral Score and details of the predictor
SIFT4G
Tolerated Score and details of the predictor
VEST
Neutral Score and details of the predictor
MitoClass 1
Neutral Score and details of the predictor
SNPDryad
Neutral Score and details of the predictor
MutationTaster
Polymorphism Score and details of the predictor
fathmm
Tolerated Score and details of the predictor
AlphaMissense
Likely benign Score and details of the predictor
CADD
Neutral Score and details of the predictor
PROVEAN
Tolerated Score and details of the predictor
Mutation Assessor
Neutral Score and details of the predictor
EFIN SP
Neutral Score and details of the predictor
EFIN HD
Neutral Score and details of the predictor
MLC
Neutral Score and details of the predictor
PANTHER
.
PhD-SNP
.

Pathogenicity meta-predictors

APOGEE1
Neutral Score and details of the meta-predictor
APOGEE2
Likely-benign Score and details of the meta-predictor
CAROL
Neutral Score and details of the meta-predictor
Condel
Deleterious Score and details of the meta-predictor
COVEC WMV
Neutral Score and details of the meta-predictor
MtoolBox
Deleterious Score and details of the meta-predictor
DEOGEN2
Tolerated Score and details of the meta-predictor
Meta SNP
.

Cancer-specific predictors

PolyPhen2 transf
Low impact Score and details of the cancer-specific predictor
SIFT transf
High impact Score and details of the cancer-specific predictor
MutationAssessor transf
Low impact Score and details of the cancer-specific predictor
CHASM
Neutral Score and details of the cancer-specific predictor

Databases of Frequencies and Phenotypes

Clinvar ID
Clinvar ALLELEID
680619
Clinvar CLNDISDB
Mondo:mondo:0009723, medgen:c0023264, omim:256000, orphanet:506
Clinvar CLNDN
Leigh syndrome
Clinvar CLNSIG
Uncertain significance
MITOMAP Allele
MITOMAP Disease Clinical info
.
MITOMAP Disease Status
.
MITOMAP Disease Hom/Het
./.
MITOMAP General GenBank Freq
0.0%
MITOMAP General GenBank Seqs
0
MITOMAP General GenBank Curated refs
.
MITOMAP Variant Class
polymorphism
Gnomad AN
0
Gnomad AC hom
0
Gnomad AF hom
0.0
Gnomad AC het
.
Gnomad AF het
.
Gnomad filter
.
HelixMTdb AC hom
1
HelixMTdb AF hom
5.1e-06
HelixMTdb AC het
0
HelixMTdb AF het
0.0
HelixMTdb mean ARF
0.0
HelixMTdb max ARF
.
ToMMo JPN54K AC
5
ToMMo JPN54K AF
9.2e-05
ToMMo JPN54K AN
54300
COSMIC 90
.
dbSNP 156

Residue interaction

EVmutation
Site A-B InterP
Site A-B IntraP
ΔΔG intra
ΔΔG intra interface
ΔΔG inter

Compensated Pathogenic Deviations

Frequency
.
AA ref
.
CPD AA alt
.
Aln pos
.
RefSeq protein ID
.
Species name
.
Ncbi taxon ID
.
~ 14484 (T/C) 14484 (T/A) 14484 (T/G)
~ 14484 (ATG/GTG) 14484 (ATG/TTG) 14484 (ATG/CTG)
MitImpact id MI.23790 MI.23791 MI.23792
Chr chrM chrM chrM
Start 14484 14484 14484
Ref T T T
Alt C A G
Gene symbol MT-ND6 MT-ND6 MT-ND6
Extended annotation mitochondrially encoded NADH:ubiquinone oxidoreductase core subunit 6 mitochondrially encoded NADH:ubiquinone oxidoreductase core subunit 6 mitochondrially encoded NADH:ubiquinone oxidoreductase core subunit 6
Gene position 190 190 190
Gene start 14149 14149 14149
Gene end 14673 14673 14673
Gene strand - - -
Codon substitution ATG/GTG ATG/TTG ATG/CTG
AA position 64 64 64
AA ref M M M
AA alt V L L
Functional effect general missense missense missense
Functional effect detailed missense missense missense
OMIM id 516006 516006 516006
HGVS NC_012920.1:g.14484T>C NC_012920.1:g.14484T>A NC_012920.1:g.14484T>G
HGNC id 7462 7462 7462
Respiratory Chain complex I I I
Ensembl gene id ENSG00000198695 ENSG00000198695 ENSG00000198695
Ensembl transcript id ENST00000361681 ENST00000361681 ENST00000361681
Ensembl protein id ENSP00000354665 ENSP00000354665 ENSP00000354665
Uniprot id P03923 P03923 P03923
Uniprot name NU6M_HUMAN NU6M_HUMAN NU6M_HUMAN
Ncbi gene id 4541 4541 4541
Ncbi protein id YP_003024037.1 YP_003024037.1 YP_003024037.1
PhyloP 100V -1.482 -1.482 -1.482
PhyloP 470Way -0.435 -0.435 -0.435
PhastCons 100V 0 0 0
PhastCons 470Way 0.952 0.952 0.952
PolyPhen2 probably_damaging probably_damaging probably_damaging
PolyPhen2 score 0.99 0.98 0.98
SIFT neutral neutral neutral
SIFT score 0.49 1.0 1.0
SIFT4G Damaging Tolerated Tolerated
SIFT4G score 0.002 1.0 1.0
VEST Neutral Neutral Neutral
VEST pvalue 0.39 0.33 0.33
VEST FDR 0.5 0.5 0.5
Mitoclass.1 neutral neutral neutral
SNPDryad Neutral Neutral Neutral
SNPDryad score 0.71 0.25 0.25
MutationTaster Polymorphism Disease Polymorphism
MutationTaster score 0.93573 0.998573 0.953768
MutationTaster converted rankscore 0.26936 0.45107 0.26393
MutationTaster model simple_aae simple_aae simple_aae
MutationTaster AAE D29G D29V D29A
fathmm Tolerated Tolerated Tolerated
fathmm score 2.26 2.43 2.43
fathmm converted rankscore 0.17596 0.15261 0.15261
AlphaMissense likely_benign likely_benign likely_benign
AlphaMissense score 0.3238 0.1179 0.1179
CADD Neutral Neutral Neutral
CADD score 0.889742 -0.987796 -1.096464
CADD phred 10.02 0.017 0.01
PROVEAN Tolerated Tolerated Tolerated
PROVEAN score -1.97 0.36 0.36
MutationAssessor medium neutral neutral
MutationAssessor score 2.535 -0.225 -0.225
EFIN SP Damaging Neutral Neutral
EFIN SP score 0.236 0.842 0.842
EFIN HD Neutral Neutral Neutral
EFIN HD score 0.472 0.978 0.978
MLC Neutral Neutral Neutral
MLC score 0.46402921 0.46402921 0.46402921
PANTHER score 0.233 . .
PhD-SNP score 0.865 . .
APOGEE1 Pathogenic Neutral Neutral
APOGEE1 score 0.95 0.42 0.41
APOGEE2 Likely-pathogenic Likely-benign Likely-benign
APOGEE2 score 0.897187271374113 0.080828708259613 0.080828708259613
CAROL deleterious neutral neutral
CAROL score 0.99 0.98 0.98
Condel neutral deleterious deleterious
Condel score 0.25 0.51 0.51
COVEC WMV deleterious neutral neutral
COVEC WMV score 1 -2 -2
MtoolBox deleterious deleterious deleterious
MtoolBox DS 0.8 0.66 0.66
DEOGEN2 Tolerated Tolerated Tolerated
DEOGEN2 score 0.39216 0.200129 0.200129
DEOGEN2 converted rankscore 0.75190 0.55761 0.55761
Meta-SNP Disease . .
Meta-SNP score 0.71 . .
PolyPhen2 transf low impact low impact low impact
PolyPhen2 transf score -2.63 -2.35 -2.35
SIFT_transf medium impact high impact high impact
SIFT transf score 0.2 1.87 1.87
MutationAssessor transf medium impact low impact low impact
MutationAssessor transf score 1.42 -1.14 -1.14
CHASM Neutral Neutral Neutral
CHASM pvalue 0.58 0.64 0.64
CHASM FDR 0.8 0.8 0.8
ClinVar id 9688.0 . 693729.0
ClinVar Allele id 24727.0 . 680619.0
ClinVar CLNDISDB MONDO:MONDO:0044970,MedGen:C0751651,Orphanet:68380|Human_Phenotype_Ontology:HP:0001086,Human_Phenotype_Ontology:HP:0001112,MONDO:MONDO:0010788,MedGen:C0917796,OMIM:535000,Orphanet:104|MedGen:CN517202|MONDO:MONDO:0009723,MedGen:C0023264,OMIM:256000,Orphanet:506 . MONDO:MONDO:0009723,MedGen:C0023264,OMIM:256000,Orphanet:506
ClinVar CLNDN Mitochondrial_disease|Leber_optic_atrophy|not_provided|Leigh_syndrome . Leigh_syndrome
ClinVar CLNSIG Pathogenic . Uncertain_significance
MITOMAP Disease Clinical info LHON . .
MITOMAP Disease Status Cfrm [P] . .
MITOMAP Disease Hom/Het +/+ ./. ./.
MITOMAP General GenBank Freq 0.1129% 0.0% 0.0%
MITOMAP General GenBank Seqs 69 0 0
MITOMAP General Curated refs 11579587;36737829;17334960;34122299;10520236;31619780;31482278;7853025;28994349;8931573;16083845;19800080;19098324;10545708;15720387;27803870;1417830;24508359;15954041;20074547;23665487;21067478;32220313;15629831;9852675;16120317;17479363;18806273;19525327;29133642;19047048;37988592;38346855;10976107;23111160;17886296;16972023;9012411;31932089;11741983;15629832;20301353;12205655;12711217;14748908;8680405;7611298;28040497;31817256;15060117;12638016;29454364;33706792;15033723;17122117;11124301;21457906;27071925;37587338;30369864;21694444;19370763;2018041;28716668;22749828;7823072;17292333;15282179;15282189;12827453;16532388;27741086;36361994;34415266;29336589;34732400;19247386;29980632;1732158;18402672;33552719;12518276;17899121;19936068;30712826;30822445;16523671;34573281;18235013;15467980;10631164;22194643;12749053;27847334;29253894;21788663;30081212;29428506;27177320;27746671;9302261;25909222;34168607;17403843;20491810;27787713;31566038;7599218;19268652;12379308;32704028;20471050;25192510;25053773;23674761;29996615;23063736;8533781;11504997;20064630;33911213;20809775;34673906;14671420;9150158;30008192;32861874;20976138;33159657;21928272;7735876;21397051;10426138;16829155;15883259;18440284;8470982;21859767;36051150;17452034;31776719;10072046;30201499;27721048;26404827;29189152;36827238;35104579;35773337;7603534;15483043;7977345;33101779;15548492;12446713;8582049;15342361;17406640;15972314;27582625;7612556;12724691;8213820;17942074;35723074;24369379;7635294;11754070;22410442;20943885;32991883;11450909;36565700;16380918;28455970;21253496;25338955;7770132;20123042;11001192;31619779;18344382;36565701;9177303;12436196;9412783;16564802;28991104;17894548;7821467;35567411;35623556;28944608;29387390;7604366;12464729;29983856;18320530;34670133;37878684;31040363;20599858;11523562;37537557;18674747;21685233;8742999;37038312;9339703;8659531;12464728;12807863;28481993;16120433;20628600;33477675;32105823;1463007;29249004;26605371;19394449;7877803;32991388;35130313;7760326;12112086;35858578;18214789;8941270;28314831;19255150;11938495;21887510;18070226;33584522;19319978;15635488;11331900;24398099;22258525;32111141;33095398;8071952;33360266;28392196;28233183;19733221;11853713;31605306;20211598;16050984;28761322;9484365;16806060;27127184;34915201;19710181;30881859;8659512;15272763;21810891;15126312;8755941;9561832;11339587 . .
MITOMAP Variant Class disease polymorphism polymorphism
gnomAD 3.1 AN 56427.0 56434.0 .
gnomAD 3.1 AC Homo 30.0 1.0 .
gnomAD 3.1 AF Hom 0.00053166 1.77198e-05 .
gnomAD 3.1 AC Het 7.0 0.0 .
gnomAD 3.1 AF Het 0.000124054 0.0 .
gnomAD 3.1 filter PASS PASS .
HelixMTdb AC Hom 144.0 3.0 1.0
HelixMTdb AF Hom 0.00073475763 1.530745e-05 5.1024836e-06
HelixMTdb AC Het 26.0 0.0 0.0
HelixMTdb AF Het 0.00013266457 0.0 0.0
HelixMTdb mean ARF 0.34311 . .
HelixMTdb max ARF 0.82803 . .
ToMMo 54KJPN AC 15 . 5
ToMMo 54KJPN AF 0.000276 . 9.2e-05
ToMMo 54KJPN AN 54300 . 54300
COSMIC 90 . . .
dbSNP 156 id rs199476104 . rs199476104
For more info, please check the output legend.
ΔΔG values >±0.61 Kcal/mol are indicative of disrupting variants.
ΔΔG values close to zero (<±0.1 Kcal/mol) are indicative of possibly
compensating double mutants.
For more info, please check the output legend.
ΔΔG values >±0.61 Kcal/mol are indicative of disrupting variants.
ΔΔG values close to zero (<±0.1 Kcal/mol) are indicative of possibly
compensating double mutants.
For more info, please check the output legend.
ΔΔG values >±0.61 Kcal/mol are indicative of disrupting variants.
ΔΔG values close to zero (<±0.1 Kcal/mol) are indicative of possibly
compensating double mutants.
For more info, please check the output legend.
0
Details:
0
Score:  
0
  [min -20, max 10]
  • Predicted accelerated evolution:  score <= 0
  • Conserved:  score > 0
Score:  
0
  [min -20, max 12]
  • Predicted accelerated evolution:  score <= 0
  • Conserved:  score > 0
Score:  
0
  [min 0, max 1]
  • Non-conserved:  score <= 0.7
  • Conserved:  score > 0.7 (soft threshold)
Score:  
0
  [min 0, max 1]
  • Non-conserved:  score <= 0.7
  • Conserved:  score > 0.7 (soft threshold)
Score:  
0
  [min 0, max 1]
  • Neutral:  score <= 0.15
  • Possibly damaging:  0.15 < score <= 0.85
  • Probably damaging:  score > 0.85
Score:  
0
  [min 0, max 1]
  • Neutral:  score > 0.05
  • Deleterious:  score <= 0.05
Score:  
0
  [min 0, max 1]
  • Neutral:  score > 0.05
  • Deleterious:  score <= 0.05
Score:  
0
  [min -16.13, max 10.64]
  • Neutral:  score > 1.5
  • Deleterious:  score <= 1.5
Score:  
0
  [min 0.0, max 1.0]
  • Likely benign:  score <= 0.34
  • Ambiguous:  0.34 < score < 0.56
  • Likely pathogenic:  score >= 0.56
Score:  
0
  [min -14, max 14]
  • Neutral:  score > -2.5
  • Deleterious:  score <= -2.5 (soft threshold)
Score:  
0
  [min -6, max 6]
  • Neutral:  score <= 0.8
  • Low impact:  0.8 < score <= 1.9
  • Medium impact:  1.9 < score <= 3.5
  • High impact:  score > 3.5
Score:  
0
  [min 0, max 1]
  • Neutral:  score > 0.6
  • Damaging:  score <= 0.6
Score:  
0
  [min 0, max 1]
  • Neutral:  score > 0.28
  • Damaging:  score <= 0.28
Phred score:  
0
  [min 0, max Unlimited]
  • Neutral:  score < 20 (soft threshold)
  • Deleterious:  score >= 20
Score:  
0
  [min 0, max 1]
  • Neutral:  score < 0.5 (soft threshold)
  • Deleterious:  score >= 0.5
Score:  
0
  [min 0, max 1]
  • Neutral:  score < 0.5
  • Disease:  score >= 0.5
Score:  
0
  [min 0, max 1]
  • Neutral:  score < 0.5
  • Disease:  score >= 0.5
Score:  
0
  [min 0, max 1]
  • Polymorphism:  score < 0.5
  • Disease causing:  score >= 0.5
P-value:  
0
  [min 0, max 1]
  • Neutral:  p-value > 0.05
  • Pathogenic:  p-value <= 0.05
Score:  
0
  [min 0, max 1]
No hard-thresholds were indicated by authors (ref). Indicatively:
  • Neutral:  score < 0.9
  • Pathogenic:  score >= 0.9
No score. Categorical only
Please refer to Additional File 14: Table S10 for further details.
Score:  
0
  [min 0, max 1]
  • Neutral:  score < 0.98
  • Deleterious:  score >= 0.98
Score:  
0
  [min 0, max 1]
  • Neutral:  score < 0.5
  • Disease:  score >= 0.5
Score:  
0
  [min 0, max 1]
  • Neutral:  score < 0.5
  • Deleterious:  score >= 0.5
Score:  
0
  [min -6, max 6]
  • Neutral:  score < 0
  • Deleterious:  score > 0
  • Inaccurate prediction:  score = 0
Score:  
0
  [min 0, max 1]
  • Neutral:  score < 0.5
  • Deleterious:  score >= 0.5
DS score:  
0
  [min 0, max 1]
  • Neutral:  score < 0.43
  • Deleterious:  score >= 0.43
Pathogenicity score:  
0
  [min 0, max 1]
  • Neutral:  score ≤ 0.5
  • Pathogenic:  score > 0.5


Pathogenicity score for this variant:  
0
  [min 0, max 1]
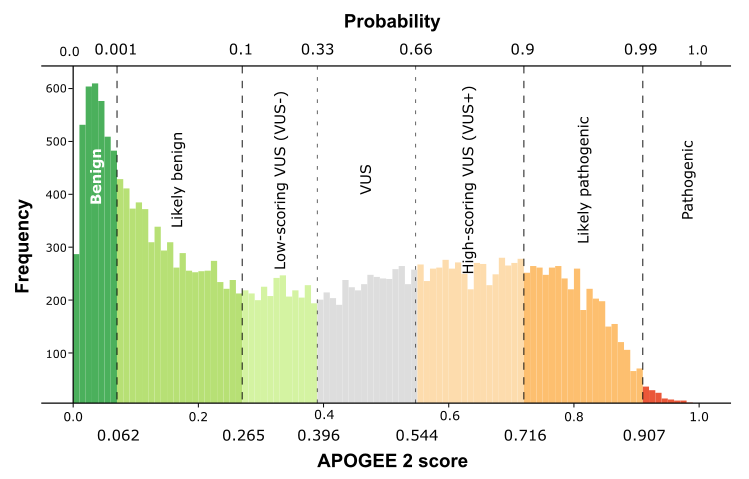
ACMG-AMP curations for mitochondrial variants should use the raw scores. Standalone probabilities are shown below:
  • Benign:  score ≤ 0.062 (prob. ≤ 0.001)
  • Likely-benign:  0.062 < score ≤ 0.265 (0.001 < prob. ≤ 0.1)
  • Low-scoring VUS (VUS-):  0.265 < score ≤ 0.396 (0.1 < prob. ≤ 0.33)
  • VUS:  0.396 < score ≤ 0.544 (0.33 < prob. ≤ 0.66)
  • High-scoring VUS (VUS+):  0.544 < score < 0.716 (0.66 < prob. < 0.9)
  • Likely-pathogenic:  0.716 ≤ score < 0.907 (0.9 ≤ prob. < 0.99)
  • Pathogenic:  score ≥ 0.907 (prob. ≥ 0.99)
Score:  
0
  [min -5, max 5]
  • Low impact:  score <= -1 (soft threshold)
  • Medium impact:  -1 < score < 1.5 (soft threshold)
  • High impact:  score >= 1.5 (soft threshold)
Score:  
0
  [min -5, max 5]
  • Low impact:  score <= -1
  • Medium impact:  -1 < score < 2 (soft threshold)
  • High impact:  score >= 2 (soft threshold)
Score:  
0
  [min -5, max 5]
  • Low impact:  score <= -1
  • Medium impact:  -1 < score < 2 (soft threshold)
  • High impact:  score >= 2 (soft threshold)
P-value:  
0
  [min 0, max 1]
  • Neutral:  FDR > 0.2
  • Driver:  FDR <= 0.2
The frequency of a CPD variant is proportional to the
number of aligned orthologous sequences that
carry a specific human pathogenic variant as
wild-type amino acid on the total number of aligned
sequences.

For more info, please check the output legend